2017-05-17
问题描述
两台mac book pro,一台安装完后执行ipython没有任何错误. 一台却报如下错误:UnknownBackend
zhouhh@/Users/zhouhh $ ipython
Python 3.6.0 |Anaconda custom (x86_64)| (default, Dec 23 2016, 13:19:00)
Type "copyright", "credits" or "license" for more information.

IPython 5.1.0 -- An enhanced Interactive Python.
?         -> Introduction and overview of IPython's features.
%quickref -> Quick reference.
help      -> Python's own help system.
object?   -> Details about 'object', use 'object??' for extra details.
[TerminalIPythonApp] WARNING | GUI event loop or pylab initialization failed
---------------------------------------------------------------------------
UnknownBackend                            Traceback (most recent call last)
/Users/zhouhh/anaconda3/lib/python3.6/site-packages/IPython/core/interactiveshell.py in enable_matplotlib(self, gui)
   2945                 gui, backend = pt.find_gui_and_backend(self.pylab_gui_select)
   2946
-> 2947         pt.activate_matplotlib(backend)
   2948         pt.configure_inline_support(self, backend)
   2949

/Users/zhouhh/anaconda3/lib/python3.6/site-packages/IPython/core/pylabtools.py in activate_matplotlib(backend)
    292     matplotlib.rcParams['backend'] = backend
    293
--> 294     import matplotlib.pyplot
    295     matplotlib.pyplot.switch_backend(backend)
    296

/Users/zhouhh/anaconda3/lib/python3.6/site-packages/matplotlib/pyplot.py in <module>()
   2532 # are no-ops and the registered function respect `mpl.is_interactive()`
   2533 # to determine if they should trigger a draw.
-> 2534 install_repl_displayhook()
   2535
   2536 ################# REMAINING CONTENT GENERATED BY boilerplate.py ##############

/Users/zhouhh/anaconda3/lib/python3.6/site-packages/matplotlib/pyplot.py in install_repl_displayhook()
    164             ipython_gui_name = backend2gui.get(get_backend())
    165             if ipython_gui_name:
--> 166                 ip.enable_gui(ipython_gui_name)
    167         else:
    168             _INSTALL_FIG_OBSERVER = True

/Users/zhouhh/anaconda3/lib/python3.6/site-packages/IPython/terminal/interactiveshell.py in enable_gui(self, gui)
    450     def enable_gui(self, gui=None):
    451         if gui:
--> 452             self._inputhook = get_inputhook_func(gui)
    453         else:
    454             self._inputhook = None

/Users/zhouhh/anaconda3/lib/python3.6/site-packages/IPython/terminal/pt_inputhooks/__init__.py in get_inputhook_func(gui)
     36
     37     if gui not in backends:
---> 38         raise UnknownBackend(gui)
     39
     40     if gui in aliases:

UnknownBackend: No event loop integration for 'inline'. Supported event loops are: qt, qt4, qt5, gtk, gtk2, gtk3, tk, wx, pyglet, glut, osx

In [1]:
解决办法
ipython 命令后用参数指定相应的matploatlib的后端为osx
zhouhh@/Users/zhouhh $ ipython --matplotlib=osx
Python 3.6.0 |Anaconda custom (x86_64)| (default, Dec 23 2016, 13:19:00)
Type "copyright", "credits" or "license" for more information.
IPython 5.1.0 -- An enhanced Interactive Python.
? -> Introduction and overview of IPython's features.
%quickref -> Quick reference.
help -> Python's own help system.
object? -> Details about 'object', use 'object??' for extra details.
In [1]:
In [2]: %matplotlib
Using matplotlib backend: MacOSX
In [3]:
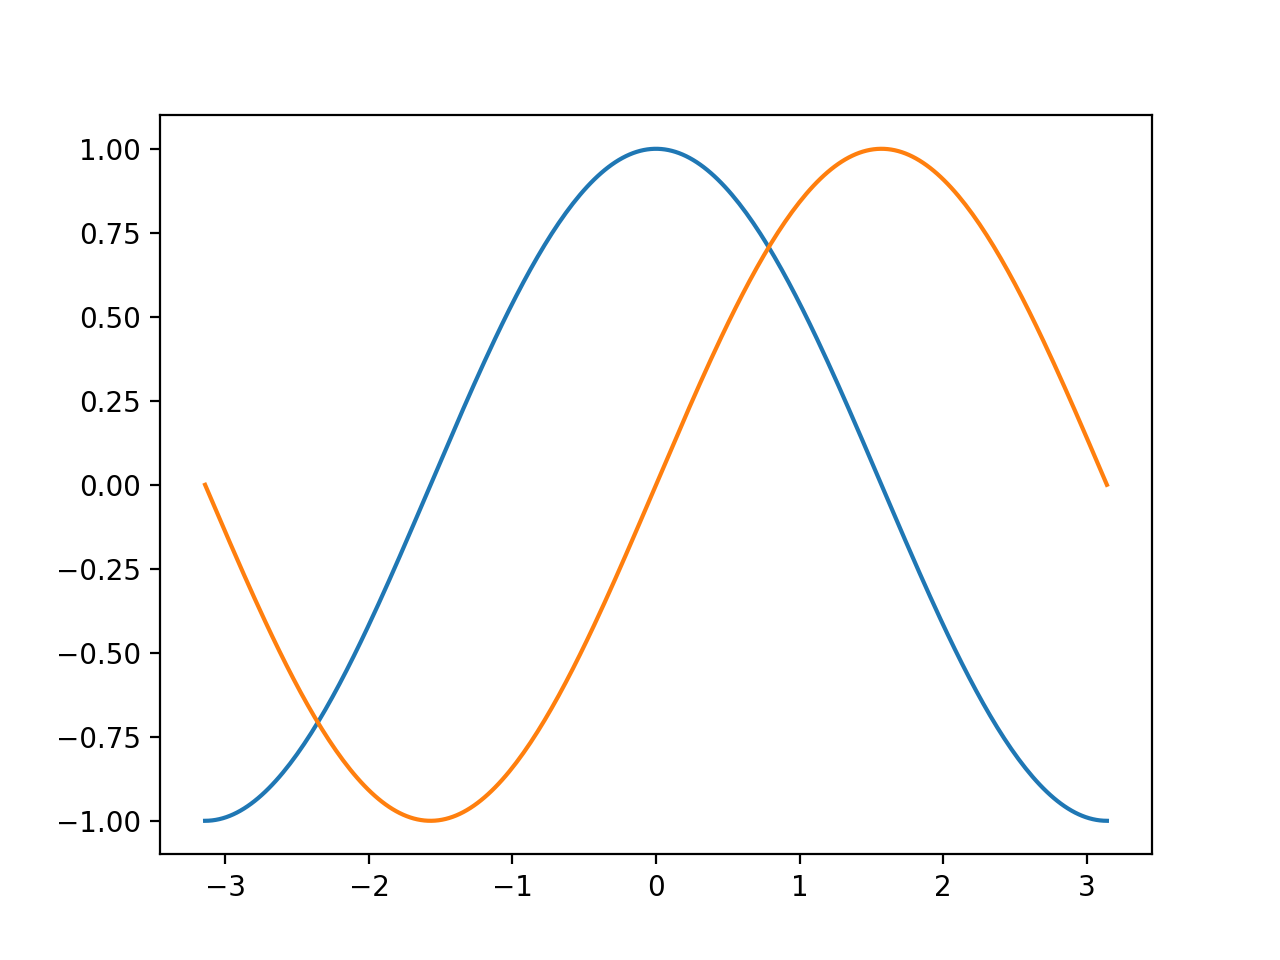
from pylab import *
X = np.linspace(-np.pi, np.pi, 256,endpoint=True)
C,S = np.cos(X), np.sin(X)
plot(X,C)
plot(X,S)
show()
Out[3]: [<matplotlib.lines.Line2D at 0x119ae7828>]
In [4]:
# 导入 matplotlib 的所有内容(nympy 可以用 np 这个名字来使用)
from pylab import *
# 创建一个 8 * 6 点(point)的图,并设置分辨率为 80
figure(figsize=(8,6), dpi=80)
# 创建一个新的 1 * 1 的子图,接下来的图样绘制在其中的第 1 块(也是唯一的一块)
subplot(1,1,1)
X = np.linspace(-np.pi, np.pi, 256,endpoint=True)
C,S = np.cos(X), np.sin(X)
# 绘制余弦曲线,使用蓝色的、连续的、宽度为 1 (像素)的线条
plot(X, C, color="blue", linewidth=1.0, linestyle="-")
# 绘制正弦曲线,使用绿色的、连续的、宽度为 1 (像素)的线条
plot(X, S, color="green", linewidth=1.0, linestyle="-")
# 设置横轴的上下限
xlim(-4.0,4.0)
# 设置横轴记号
xticks(np.linspace(-4,4,9,endpoint=True))
# 设置纵轴的上下限
ylim(-1.0,1.0)
# 设置纵轴记号
yticks(np.linspace(-1,1,5,endpoint=True))
# 以分辨率 72 来保存图片
# savefig("exercice_2.png",dpi=72)
# 在屏幕上显示
show()
或者指定pylab 参数
zhouhh@/Users/zhouhh $ ipython --pylab
Python 3.6.0 |Anaconda custom (x86_64)| (default, Dec 23 2016, 13:19:00)
Type "copyright", "credits" or "license" for more information.

IPython 5.1.0 -- An enhanced Interactive Python.
?         -> Introduction and overview of IPython's features.
%quickref -> Quick reference.
help      -> Python's own help system.
object?   -> Details about 'object', use 'object??' for extra details.
Using matplotlib backend: MacOSX

In [1]:
X = np.linspace(-np.pi, np.pi, 256,endpoint=True)
C,S = np.cos(X), np.sin(X)

plot(X,C)
plot(X,S)

show()
如果用jupyter notebook启动没有问题
%matplotlib inline
from pylab import *
import numpy as np
X = np.linspace(-np.pi, np.pi, 256,endpoint=True)
C,S = np.cos(X), np.sin(X)

plot(X,C)
plot(X,S)

show()
 如果怕麻烦,可以在.zshrc或.bashrc中添加ipython的alias
如非注明转载, 均为原创. 本站遵循知识共享CC协议,转载请注明来源
FEATURED TAGS
css
vc6
http
automake
linux
make
makefile
voip
乱码
awk
flash
vista
vi
vim
javascript
pietty
putty
ssh
posix
subversion
svn
windows
删除
编译
多线程
wxwidgets
ie
ubuntu
开源
c
python
bash
备份
性能
scp
汉字
log
ruby
中文
bug
msn
nginx
php
shell
wordpress
mqueue
android
eclipse
java
mac
ios
html5
js
mysql
protobuf
apache
hadoop
install
iocp
twisted
centos
mapreduce
hbase
thrift
tutorial
hive
erlang
lucene
hdfs
sqoop
utf8
filter
草原
yarn
ganglia
恢复
scrapy
django
fsimage
flume
tail
flume-ng
mining
scala
go
kafka
gradle
cassandra
baas
spring
postgres
maven
mybatis
mongodb
https
nodejs
镜像
心理学
机器学习
Keras
theano
anaconda
docker
spark
akka-http
json
群论
区块链
加密
抽象代数
离散对数
同余
欧拉函数
扩展欧几里德算法
ES6
node-inspect
debug
win10
vscode
挖矿