其实,如果能跟踪监视Windows启动时所做的每件事,并记录其所花费时间,和它本来应该花费的时间进行比较,就能发现异常。上文(如何解决win7开机关机很慢的问题(一))提到的Windows SDK 就自带工具,可以用于诊断windows启动,关机,睡眠和休眠的问题,叫Windows 性能分析命令行工具包,简称WPT。
Windows Performance Analyzer Command-Line Tools
| **Tool** | **Purpose** |
| **Xbootmgr.exe****** | The Xbootmgr tool controls the state transition test environment. It automates the collection of reliable on/off performance traces. Xbootmgr also initializes ETW tracing so that data can be captured during transitions. |
| **Xperf.exe****** | During on/off transition analysis, Xperf performs post processing. It generates summary reports in XML for all on/off transitions and provides raw event dumps for detailed investigations. |
| **Xperfview.exe****** | Xperfview provides a detailed visualization of performance data. |
Xbootmgr 用于收集系统启动关闭的时间数据。xperf则对收集的系统日志进行过滤分析,并生xml摘要或原始数据,或用xperfview来直观查看性能数据。
工具包下载安装:
http://www.microsoft.com/download/en/details.aspx?displaylang=en&id=3138
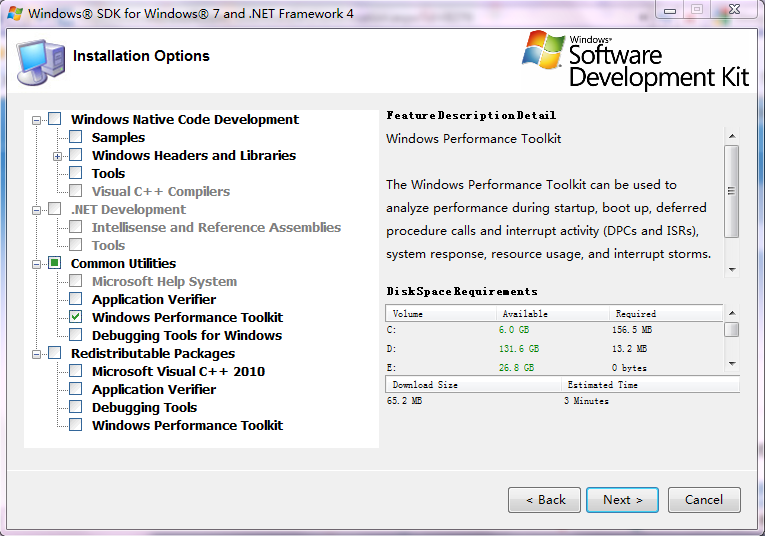
下载winsdk_web.exe,然后启动该程序,选择所要的WPT工具:
启动性能分析:
先安装完Windows SDK包中的性能分析工具包,
在命令行执行
xbootmgr.exe -trace boot
当然,参数还可以是
xbootmgr _-trace boot
-trace shutdown
-trace standby
-trace hibernate
-trace rebootCycle
_
对应的xperf 命令为
_xperf -i 文件名 -a boot
-a shutdown
-a suspend
-a suspend
_

_-a boot
-a shutdown_
如果是时间跟踪,命令行为:xbootmgr -trace boot -traceFlags base+cswitch+compact_cswitch -prepsystem
我们用时间和分析跟踪,命令行:
xbootmgr -trace boot -numRuns 3 -resultPath %systemdrive%traces -postBootDelay 180 -traceFlags latency+dispatcher -stackWalk Profile+CSwitch+ReadyThread -prepsystem
用管理员帐号在命令行执行上面的命令,enter后过5秒系统自动重启几次。-prepsystem参数会在这几次重启中自动优化系统。-resultPath 指定结果存放目录。
重启几次后,得到如下的文件:
_C:traces>dir
 驱动器 C 中的卷没有标签。
 卷的序列号是 D80F-B131_

_ C:traces 的目录_

_2011/08/13  10:36    <DIR>          .
2011/08/13  10:36    <DIR>          ..
2011/08/13  09:50            43,946 bootPrep_latency+dispatcher_1.cab
2011/08/13  09:50       512,753,664 bootPrep_latency+dispatcher_1.etl
2011/08/13  09:55            61,481 bootPrep_latency+dispatcher_2.cab
2011/08/13  09:55       479,199,232 bootPrep_latency+dispatcher_2.etl
2011/08/13  10:09           213,243 bootPrep_latency+dispatcher_3.cab
2011/08/13  10:09       811,597,824 bootPrep_latency+dispatcher_3.etl
2011/08/13  10:14           224,042 bootPrep_latency+dispatcher_4.cab
2011/08/13  10:14       488,636,416 bootPrep_latency+dispatcher_4.etl
2011/08/13  10:18           224,541 bootPrep_latency+dispatcher_5.cab
2011/08/13  10:18       325,058,560 bootPrep_latency+dispatcher_5.etl
2011/08/13  10:23           226,792 bootPrep_latency+dispatcher_6.cab
2011/08/13  10:23       311,427,072 bootPrep_latency+dispatcher_6.etl
2011/08/13  10:27           228,119 boot_latency+dispatcher_1.cab
2011/08/13  10:27       304,087,040 boot_latency+dispatcher_1.etl
2011/08/13  10:33           301,531 boot_latency+dispatcher_2.cab
2011/08/13  10:33       494,927,872 boot_latency+dispatcher_2.etl
2011/08/13  10:36           301,704 boot_latency+dispatcher_3.cab
2011/08/13  10:36       375,390,208 boot_latency+dispatcher_3.etl
2011/08/13  10:36            13,437 xbootmgr.log
              19 个文件  4,104,916,724 字节
               2 个目录  1,946,624,000 可用字节_
可以看出来,etl文件是分析数据,都很大。
我们可以用xperfview.exe来进行图形化观测。不过好像并不如xml来的直接。
在开始菜单找到 Microsoft Windows Performance Toolkit下的Performance Analyzer,就是xperfview.exe,可以用它打开etl文件,工具会形成直观的图形,分析cpu,磁盘io,各进程加载和生命周期:

用xperf.exe来生成xml摘要文件,更容易分析阅读。
执行下面的命令:
_C:traces>xperf -i bootPrep_latency+dispatcher_1.etl -o sum.xml -a boot
xperf: warning: applying restriction of access for trace processing
[1/2]    100.0%
[2/2]    100.0%_

_C:traces>xperf -i bootPrep_latency+dispatcher_6.etl -o sum6.xml -a boot
xperf: warning: applying restriction of access for trace processing
[1/2]    100.0%
[2/2]    100.0%_
生成了两个摘要文件sum.xml和sum6.xml,在ie中打开:

这是没有优化时的时间。
这是优化后的时间:

优化后的确快了不少。
如非注明转载, 均为原创. 本站遵循知识共享CC协议,转载请注明来源